 |
 |
Haniwa is part of Aizu History Project, whose primary goal is to furnish educational resources in Japanese history and culture focused on the Aizu region of north central Japan. A team from the Computer Arts laboratory of University of Aizu, is using three-dimensional modeling techniques to generate virtual historical sites and precious artifacts that have been destroyed and digitally preserve objects that might face destruction in the future.
Haniwa is a general term for unglazed
clay artifacts, which were lined up on the outer surface of mounded tombs.
haniwa
can be separated into 2 main types, cylindrical and representational
haniwa.
Cylindrical
haniwa, the earliest type, are formed in the likeness
a cylindrical vase, and representational
haniwa, the most common
type throughout the Kofun period, have a variety of shapes, which are enhanced
from man made, and nature objects. These included various animals, humans
of all social standings, buildings, armor, weapons, shields and other things
(see fig.1).
|
|
The custom of Haniwa around the tombs of nobles transpires during the Kofun era. The Kofun period extends roughly from the late 3rd century or early 4th century to the end of the 7th century [7]. The most unique mounds of the Kofun Period are the keyhole-shaped mounds (see fig.2), thought to be associated with the Imperial Family. The early mound tombs took advantage of natural topography, and are located mostly in hilly areas. The rows of Haniwa minimally served to reduce erosion of the mound. Their origin and purpose are unknown. Haniwa seem to represent various aspects of the funeral rites or beliefs about life after death. The beauty of the haniwa is a quality that shines though and above the politic restriction on these figures. It is a vibrancy and commitment that gives living substance to these faithful copies of events and people long past [8].
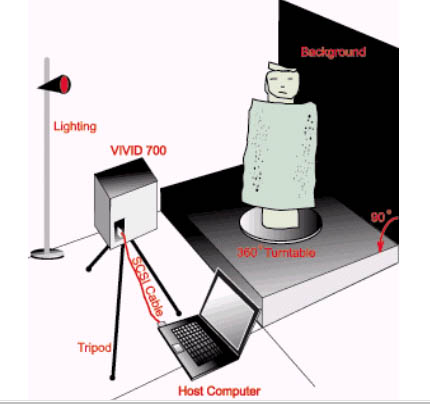
3.1. Diagram of scanning
Several attempts were made in the scanning
process (see fig.3). 12 scans were made to scan the whole Haniwa;
unfortunately non-complete data was received.
Twelve scans were taken from every segment,
such as Front, Left, Back, Right, Top and Bottom angles. We shoot 2 different
position/targets for each scan for every segment (see fig.4). Front, Left,
Back and Right part, target scan from scan 1 and scan 2 are applied.
For Top segment we use target T1 and T2
and target B1 and B2 for bottom part. 12 target-scanned areas are the minimum
efforts made. Maximum target scan does not mean a very precise dimension
of data will be obtained. Many considerations should be taken before dealing
with ancient artifacts, which are fragile, irregular and intricate.
 |
 |
3.2. Laser scanning technique
When the scanner initiates the laser, which emits a laser beam that is reflected off a mirror causing the laser beam to spread out from a point reflection to horizontal line reflection. As the mirror rotates the laser beam reflects back from the artifact, as a red line appears to travel from the top to the bottom of the artifact. This process can be referred to as "painting" the artifact. As the reflected laser beam returns to the digitizing lens, the Vivid 700 calculates the 3 dimensional positions of each point at which the laser began its return trip to the digitizing lens. Once the laser beam line reaches the bottom of its reflecting range, the laser and mirror are returned to their original states, ready to paint the artifact again if necessary. Lastly, the digitizing lens takes a digital photograph of the artifact. The 3D point data and its associated digital photograph are then compiled by the Vivid 700, and sent to the Vivid data-capturing application running on the workstation. This compiled 3D data and digital image is saved as a *.cam file (camera data file) at this time, is referred to by the Active Template Library (ATL) as a "scan."
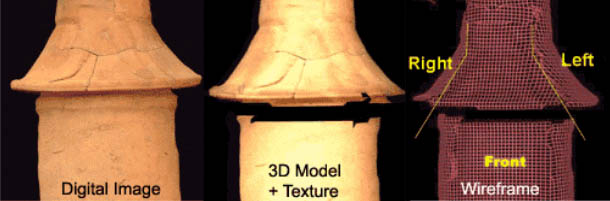
3.3. Scanning problems
Physical model was scanned from three different
angles, but missing data still occurred in the digital model. In the Figure
5, joining parts between body and stand are missing. Even though these
were scanned three times from Left, Right and Front, missing data still
took place.
 |
Reasons why missing data occurred:
a) Color: Laser cannot trace and examine black and dark surfaces. If a dark spot is being inspected, a hole will be created. There are many dark spots on haniwa, which is a problem during the process. Vivid 700 uses Laser light-stripe triangulation rangefinder, which means Laser radiation is emitted from this aperture. It emits a line laser to an object and receives the reflected light by a Charge Coupled Device (CCD), then calculates the distance to the object using triangulation. It looks like repeatedly slicing an object horizontally with a line laser.
b) Material: Shiny and reflective material is not recommended. A Semi-transparent object such as wax [6] can produce inaccurate and varied data. Dark colors are not suitable due to low laser reflectance. Material, which causes mirror reflection cannot be scanned since no striped light can be recognized due to non-diffuse reflection of the laser light.
c) Ambient Lighting: Uneven lighting sources also create problems for the ambiance of the workplace. Shadows around object easily fail the process of scanning. Proper lighting system in controlling the intensity of lighting is needed. VIVID 700 are not designed for outdoors use. It should be used under brightness of 500 lx or less.
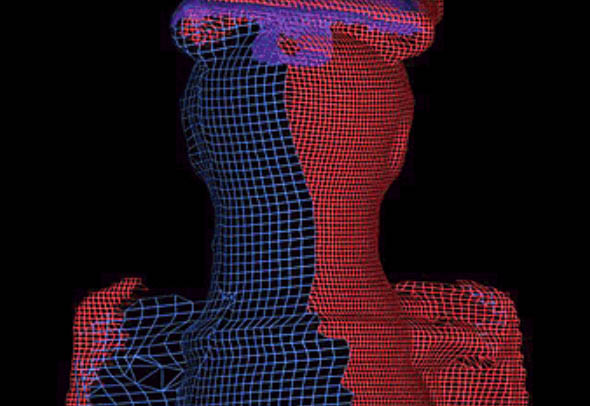
d) Level and Angle of Camera: Inconsistent
level and degree angle of the camera digitizing equipment will affect the
accuracy of data. It will create vertices with different values. For example,
the shape of ancient haniwa is intricate. If the object is near the digitizing
equipment, thousand of points/vertices will be created in the scanning
process, which may be useful for recording the intricate details. However,
this creates a large amount of data to computationally handle. If the object
is far from the digitizing equipment, fewer points/vertices will be created,
which is useful for reduction of data and if the object surface is simple.
The problem is joining or attaching the two surfaces; complex, thousand
of points to simple, fewer points [see fig.6].
 |
e) Rotary Calibrator: Rotary Calibrator might help for simple object, but for more difficult objects, especially from top and bottom angle, the rotary calibrator is not helpful. Having an assistant hold the object at a desired position still resulted in lost data.
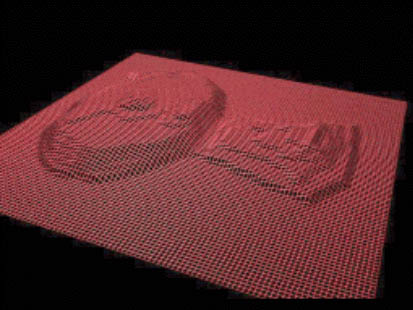
4. Optimizing the cloud of points
Using non-contact laser scanning allowed us to easily obtain and calculate points on the surface of an object, as follows: Vivid data-capturing applications (running on Unix and Window NT workstation) compiled 3D data and digital image are saved as a *.cam file (camera data file), referred to by the ATL as a "scan". A *.dxf file format version of the above scanned data of the haniwa was created. All the scans were combined into one object, resulting in 7541 vertices [see fig.7a]. Vertices that were within 0.1 unit radius of one another were removed creating a single unified polygon mesh. Then all the polygons including those of a top hairpiece and excluding those of the face were erased in order to obtain a more spherical shape, again removing overlapping vertices in a 0.1 unit radius of one another.
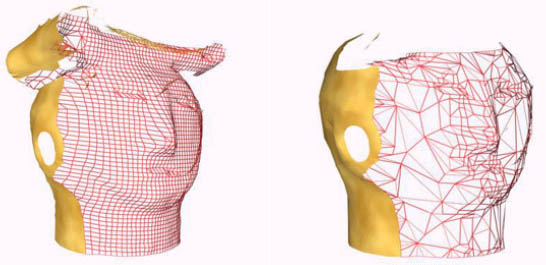
|
|
|
This was then optimized with the Optimize Modifier in 3D Studio Max [10] to reduce polygons and exported as a raw data file in plain text. The above process reduced the initial data to 1020 vertices or points from 7541, a reduction of 86.4% [see fig.7b]. This was crucial for using the volume spline based on the Green function for our F-Rep model because of the Green function limitations in handling a large number of points algorithmically and with regard to computational time in the further function evaluations.
5. Model reconstruction using a volume spline
In this work, we applied the function representation F-Rep and particularly the volume spline based on the Green function [1] to reconstruct the 3D model from the cloud of points. In the Computer Arts Laboratory of the University of Aizu, there are two teams, HyperFun and Virtual Heritage, which combine ideas and knowledge and synchronize them for their research. Data from digital artifacts can be manipulated and generate other interesting resources for research. Consequently the HyperFun team implemented the volume spline based on the Green function in HyperFun to reconstruct the F-Rep model of the scanned Haniwa artifact.
We describe briefly the algorithm of [1] in this part, for more details, we suggest to read [1, 2]. The input of the algorithm is a discrete set of points {x1, , xn} based on this set of points, we want to obtain in output the function representation (F-Rep) defining the volume as f(x,y,z) ? 0.
The first step of the algorithm consists in choosing a Carrier Function (fc), which is an approximation of the object. In the simplest case we can take a ball, whose radius is a parameter of the process. For each of the scanned points (xi, i=1 n), we will compute the value of the carrier function (fc(xi) = ri) at this point. The carrier model used for the haniwa was based on the radius of the sphere approximating the face.
The next step is to compute the interpolating
volume spline U. We choose for the interpolating function:
(1)
where: .
(The name of the algorithm is
derived from the fact that g is based on the Green function associated
with a differential operator (see [1])).
Computing the interpolating function
U is equivalent to the computation of the coefficient (?j j=1
n+k). For
computing these coefficients, we use the fact that:
(2)
It requires the solution of a system
of linear equations, with a symmetric but non-positive definite matrix.
This problem is usually solved using the Householder method, which is a
process in O(n3) where n is the size of the matrix or the number of control
points, in our case 1020.
Finally, the last step of the algorithm
consists in computing f as:
f(x,y,z) = U(x,y,z) fc(x,y,z),
where f is the function representation
of the reconstructed object.
5.1. Implementation of the HyperFun library function
The HyperFun project [3] consists in
the definition of a language and a set of tools for F-Rep geometric modeling.
In the theory of F-Rep [11] each geometric object is defined by a real
function of several variables such as:
F(x1,..,xn) ? 0
The HyperFun set of tools is provided with an existing library of primitives (sphere, ellipsoid, block, blobby object, meatballs, ) and operations (rotation, translation, twisting, stretching ...). This library is implemented in ANSI-C. The implementation of the reconstruction algorithm described in [1] has been made in C++ by Partick Preuter (preuter@labri.fr). Our teams implementation has been made in ANSI-C as a library function for HyperFun.
The code works as follows: the first time that the function for reconstructing the volume (hfGreen()) is called, we solve the linear system (eq. 2) and store in memory the coefficients ?j, then we compute the value of hfGreen() at the requested point. This first step is clearly time consuming, because of the resolution of the linear system. The next time the function hfGreen() is called, we only compute its value at the requested point (since the ?j are stored in memory).
5.2. Using the function with the HyperFun set of tools
The prototype of the function in the
HyperFun language is:
hfGreen (x, a);
where x is the point at which we want
the value of the function
a is the radius of the sphere (used
as carrier the function)
5.3. Graphical results
Figure 8a and 8b shows the reconstruction of the haniwa face. Constructing the function defining a volume from a cloud of point is a time consuming process. It took approximately 45 minutes on a Pentium 200Mhz with 64 Mbytes of RAM (a relatively low end machine) to compute the volume spline, to polygonize and to display the haniwa face from a set of 1020 points.

Fig. 8a Polygonizer
of HyperFun
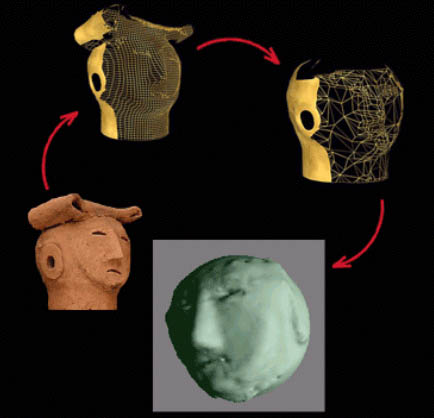
Fig. 8b Polygonizer
of HyperFun
6. Conclusion
The advantages of using the volume spline
based on the Green function are the following:
a) No regular structure of the point
cloud is required, the points can be arbitrarily scattered
b) The holes or areas with missing
points (as described above) are patched by the spline automatically
c) It provides an F-Rep model of the
object, which can later undergo all operations legal in F-Rep (set-theoretic,
blending, metamorphosis, sweeping, etc.).
An F-Rep model, using F-Rep geometric protocol, is highly suitable for long term digital preservation, archiving and global exchange of models among systems and people [4]. In future work, we will investigate using Magnetic Resonance Imaging (MRI) for capture of volume data of an object in order to digitally record the structure and materials of that object. The representation of multi-dimensional structure (bumps, cracks, roughness, chemical composition, aging, ) is out of the range of boundary representation polygonal surface data, but it is possible with F-Rep.
7. References
[1] Vladimir V. Savchenko, Alexander A.Pasko, Oleg G.Okunev and Tosiyasu L. Kunii, Function Representation of Solids Reconstruction from Scattered Surface Points and Contours, Computer Graphics Forum, vol.14, No.4, 1995, pp.181-188.
[2] J.C. Carr, R.K. Beatson, T.J. Mitchell, W.R. Fright, B.C. McCallum, T.R. Evans, Reconstruction and Representation 3D Objects with Radial Basic Function, SIGGRAPH'2001, ACM, pp. 67-76.
[3] HyperFun Project: Language and Tools for Geometric Modelling, www.hyperfun.org
[4] Carl Vilbrandt, Alexander Pasko, Galina Pasko, Janet R. Goodwin and James M. Goodwin, Digital Preservation of Culture Heritage through Constructive Modeling, International Cultural Heritage Informatics Meeting ichim01 (Milan, Italy, September 3-7), D. Bearman and F. Garzotto (Eds.), vol. 1, 2001, pp. 183-200.
[5] Carl W. Vilbrandt, Janet R. Goodwin, James M. Goodwin, Computer Models of Historical Sites: Sazaedó Sazaedou - From the Aizu History Project", Proceedings, 1999 EBTI, ECAI, SEER & PNC Joint Meeting (Taipei: Academia Sinica), pp. 489-502.
[6] Shinano Saze, 3D Reconstruction of Tanamo Saigos Head, Graduation Thesis, University of Aizu, Japan, March 2001.
[7] Nihon Genshi Bijyutu Taikei 3 (Archeology Treasures of Japan, Clay Figurines, Haniwa), 1977, July 15, pp. 202 207.
[8] Mizuno Masayoshi, Nihon Genshi Bijyutu Taikei 3 (Archeology Treasures of Japan, Clay Figurines, Haniwa), 1977, July 15, pp.207.
[9] 3D Digitizers, non-contact 3D Laser Scanner www.minolta3d.com
[10] 3D Studio MAX, http://www.discreet.com/products/3dsmax/
[11] Shape Modeling and Computer Graphics with Real Functions, wwwcis.k.hosei.ac.jp/~F-rep/
8. Acknowledgements
Acknowledgement for the information supports from Fukushima Museum, Aizu Wakamatsu-Shi, Fukushima ken, Japan and Computer Arts Laboratory, University of Aizu, Japan and special thanks to Professor Carl Vilbrandt and Jody Vilbrandt. Not forgetting special thanks to Professor Alexander Pasko (Hosei University, Japan), Sebastian Dedieu (LaBRI, University of Bordeaux, France) and Patrick Preuter (LaBRI, University of Bordeaux, France).
All trademarks are acknowledged.